The graph below shows the changes in food consumption by Chinese people between 1985 and 2010.
Summarise the information by selecting and reporting the main features, and make comparisons where relevant.
Write at least 150 words.
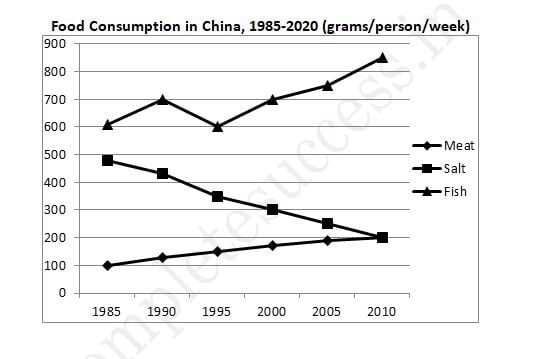
The graph shows changes in the amount of fish, salt and meat eaten per person per week in China between 1985 and 201 0.ln 1985, the consumption of fish stood at 610 grams, then increased to 700 grams in 1 990. The amount consumed decreased steadily from almost 500 grams per person to only 200 grams by 201 0.
However, this gradually increased throughout the period. Overall, the consumption of fish rose, while the consumption of salt fell. The amount of meat consumed weekly started at about 100 grams. From the graph, we can see that people in China consumed more fish than either meat or salt throughout the period.
By 2010 it was at the same level as the consumption of salt. In contrast, there was a consistent drop in salt consumption. Although it dipped in 1995, it then rose steadily and reached 850 grams in 201 0m addition, the consumption of meat, while at a relatively low level, rose significantly during this period.