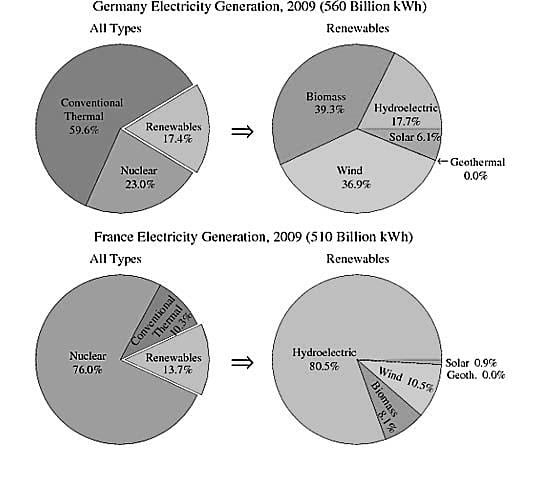
The pie charts illustrate the percentage of power production from various sources and the major renewable energy sources in Germany and France in 2009. The units are given in billion kWh.
Overall, conventional thermal was the primary source of electricity in Germany, whereas it was nuclear in France. Germany utilised various renewable sources more evenly compared to France which mainly used hydroelectric energy.
In detail, both countries followed contrasting ways of power generation. Out of total 510 billion kWh units of electricity, Germany produced about three fifths of energy from heat energy and 23% from nuclear. France, on the other hand, generated 510 kWh units, more than four fifths from Nuclear and only around 10% from thermal energy.
With regard to renewable resources, although both countries produced about similar amounts of energy from these sources, Germany (17.4%) and France (13.7%), the usage of the different renewable sources was quite different. Germany used biomass and wind energy for above 75% renewable energy and 17% from hydroelectric and rest from solar. France, however, used hydroelectric to produce 80.5 % energy. Solar contributes less than 1% and the rest from biomass and wind. Interestingly, neither country used geothermal energy.