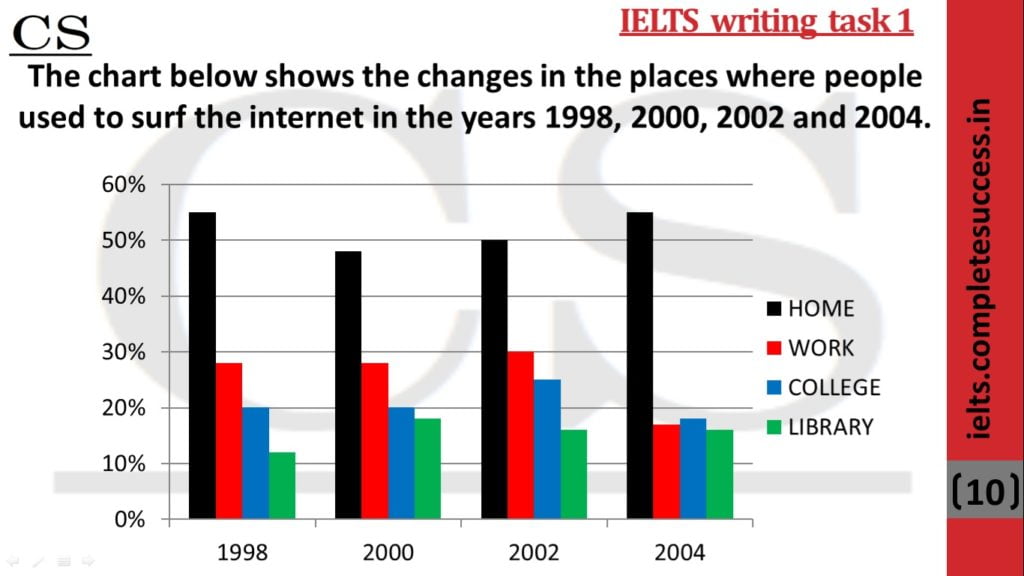
This bar graph demonstrates the changes in the percentage of people who accessed the internet between 1998 and 2004.
Overall, it can be seen from the graph that more people surfed the internet at home While people used the least internet in library.
It is apparent from the graph that the percentage of people who surfed the internet at their home was 55% in 1998 then it declined slightly to 48% in 2000. After that, it started to rise and reached again to 55% by 2004. the least percentage surf the internet in library. This percentage fluctuated from 12% to 18%.
On the contrary, the second and third places for surfing were work offices and colleges. In 1998 and 2002, the number of internet users was the same at office and college which made up just over a quarter and 20% respectively. After a slight increase in the number of internet users at office and college to 30% and 25% respectively, both came down to almost 16%.